
Activity 21.
This activity concerns a function \(f(x)\) about which the following information is known:
-
\(f\) is a differentiable function defined at every real number \(x\)
-
\(\displaystyle f(2) = -1\)
-
\(y = f'(x)\) has its graph given in the following figure.
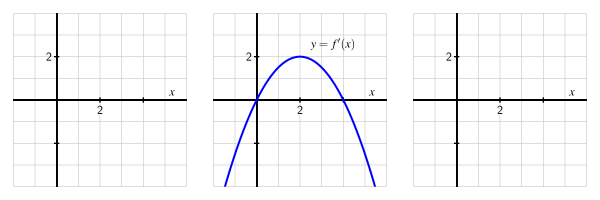
The graph of \(f'(x)\) is given. It is a parabola opening downward having a vertex at \((2,2)\) and \(x\)-intercepts at \((0,0)\) and \((4,0)\text{.}\)
Your overall task is to determine as much information as possible about \(f\) (especially near the value \(a = 2\)) by responding to the questions below.
(a)
Find a formula for the tangent line approximation, \(L(x)\text{,}\) to \(f\) at the point \((2,-1)\text{.}\)
Hint.
Find the value of \(f'(2)\) from the given graph of \(f\text{.}\)
Answer.
\(L(x) = -1 + 2(x-2)\text{.}\)
Solution.
Since \(f(2) = -1\) and \(f'(2) = 2\text{,}\) we have \(L(x) = -1 + 2(x-2)\text{.}\)
(b)
Use the tangent line approximation to estimate the value of \(f(2.07)\text{.}\) Show your work carefully and clearly.
Hint.
Remember that \(f(2.07) \approx L(2.07)\text{.}\)
Answer.
\(f(2.07) \approx L(2.07) = -0.86\text{.}\)
Solution.
Using our work in (a), \(f(2.07) \approx L(2.07) = -1 + 2(2.07-2) = -1 + 2\cdot 0.07 = -0.86\text{.}\)
(c)
Sketch a graph of \(y = f''(x)\) on the righthand grid in the provided figure; label it appropriately. Write a sentence to explain why your graph looks the way it does.
Hint.
The graph of \(y = f''(x)\) is the derivative of the graph of \(y = f'(x)\text{.}\)
Answer.
See Figure 157.
Solution.
See Figure 157.
(d)
Is the slope of the tangent line to \(y = f(x)\) increasing, decreasing, or neither when \(x = 2\text{?}\) Explain.
Hint.
Is \(f'\) increasing, decreasing, or neither when \(x = 2\text{?}\)
Answer.
Neither.
Solution.
The slope of the tangent line to \(y = f(x)\) is increasing for \(x \lt 2\) because \(y = f'(x)\) is an increasing function on this interval. Similarly, for \(x > 2\text{,}\) the slope of the tangent line to \(y = f(x)\) is decreasing. Right at \(x = 2\text{,}\) the slope of the tangent line to \(y = f(x)\) is neither increasing nor decreasing.
(e)
Sketch a possible graph of \(y = f(x)\) near \(x = 2\) on the lefthand grid in the provided figure. Include a sketch of \(y=L(x)\) (found in part (a)). Explain how you know the graph of \(y = f(x)\) looks like you have drawn it.
Hint.
Draw \(y = L(x)\) first. Then think about options for \(f\) relative to the graph of \(L\text{.}\)
Answer.
See Figure 157, which shows, at left, a possible graph of \(y = f(x)\) near \(x = 2\text{,}\) along with the tangent line \(y = L(x)\) through \((2, f(2))\text{.}\)
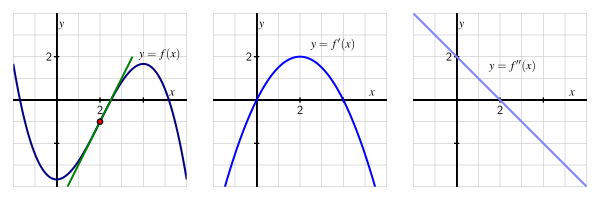
The graph on the left shows what appears to be a cubic with a tangent line at \((2,-1)\text{.}\) The graph at the right is that of a downward-sloping line passing through \((0,2)\) and \((2,0)\text{.}\)
Solution.
See the plot in Figure 158, which shows, at left, a possible graph of \(y = f(x)\) near \(x = 2\text{,}\) along with the tangent line \(y = L(x)\) through \((2, f(2))\text{.}\) Note that \(y = f(x)\) is concave up for \(x \lt 2\) since \(f'\) is increasing on that interval, and \(y = f(x)\) is concave down for \(x > 2\) since \(f'\) is decreasing there. Hence \(y = f(x)\) changes from concave up to concave down right at \(x = 2\text{,}\) which is also the point near 2 where the graph of \(y = f(x)\) is steepest.
The graph on the left shows what appears to be a cubic with a tangent line at \((2,-1)\text{.}\) The graph at the right is that of a downward-sloping line passing through \((0,2)\) and \((2,0)\text{.}\)
(f)
Does your estimate in (b) over- or under-estimate the true value of \(f(2.07)\text{?}\) Why?
Hint.
Does the tangent line lie above or below the graph of \(y = f(x)\) at \((2,3)\text{?}\)
Answer.
Too large.
Solution.
Because the tangent line to \(y = f(x)\) lies above the graph of \(f\) to the right of \(x = 2\text{,}\) our estimate of \(f(2.07)\) is too large — the local linearization overshoots the true value of \(f\) at this point.

