
Print preview
Handout Daily Prep 4.4 - The Fundamental Theorem of Calculus
Section Overview
In this section we see how antiderivatives allow us to compute a definite integral using the The Fundamental Theorem of Calculus. In this result, we see formally how the net-signed area under a curve is connected to the antiderivative of the function that generates the curve. This result extends our earlier work where we saw that slopes on the graph of \(f\) generate heights on the graph of \(f'\text{;}\) now we can also see that net-signed areas between \(f'\) and the \(x\)-axis are connected to differences in heights on \(f\text{.}\)
Section Basic learning objectives
These are the tasks you should be able to perform with reasonable fluency when you arrive at our next class meeting. Important new vocabulary words are indicated in italics.
-
Recognize that the change in position of an object gives the net-signed area bounded by a velocity curve on an interval \([a,b]\text{:}\) \(\int_{a}^{b} v(t) \ dt = s(b)-s(a)\text{.}\)
-
Define an antiderivative.
-
State the Fundamental Theorem of Calculus: \(\int_{a}^{b} f(x) \ dx=F(b)-F(a)\text{,}\) where \(F\) is any antiderivative of \(f\text{.}\)
-
Apply the Fundamental Theorem of Calculus to compute definite integrals.
Section To prepare for class
Complete all actions listed below. Respond to the questions highlighted with Submit.
-
Read motivating questions and the introduction to section 4.4 (up until Preview Activity 4.4.1).
-
-
(Optional) Watch video solution of Preview Activity 4.4.1 (8:24).
-
(Optional) Solutions to the Preview Activity 4.4.1 appear in Answers below.
-
-
Read section 4.4.2 up to Activity 4.4.2.
-
Prompt Copilot “How is the fundamental theorem of calculus related to finding distance traveled by finding area under a velocity curve?”
-
📝 [Submit] Watch video Fundamental Theorem of Calculus with Power Functions (7:32). Note that the presenter does a terrible job in evaluation of \(\displaystyle \int_{-1}^{3} 3x^{2} - 2x + \pi \ dx\) by not using any = signs in the presentation. Correct this by carefully writing the solution properly using appropriate notation (i.e. use equality signs as needed).
-
Do these problems.
-
Evaluate \(\displaystyle \int_{0}^{1} 1-x^{2} \ dx\text{.}\) Sketch a graph with the shaded region the answer represents. Does your answer appear to be reasonable?Prompt Copilot “Evaluate $int_0\(\wedge\)1 1-x\(\wedge\)2 dx$. Then, produce and execute python code that will sketch a graph with the shaded region the answer represents.”
-
-
Use geometry to evaluate \(\displaystyle \int_{-1}^{4} 1-\frac{1}{2}x \ dx\text{.}\)
-
Use the Fundamental Theorem of Calculus to evaluate this definite integral. Note that you should get the same numerical value!
-
-
Evaluate \(\displaystyle \int_{0}^{\pi/2}\cos x \ dx\text{.}\) Sketch a graph with the shaded region the answer represents. Does your answer appear to be reasonable? Hint: What function has derivative of \(\cos x\text{?}\)
-
-
📝 [Submit] Explore the applet 1st Fundamental Theorem built in Desmos. The applet shows that the area under a curve defined by \(f(x)\) (shaded blue) is equal to the difference in heights \(F(b)-F(a)\) of an antiderivative \(F(x)\) at the endpoints \(a\) and \(b\text{.}\) Then, draw your own well-labeled figure illustrating this idea for \(\displaystyle \int_{-1}^{2} 3x^{2} \ dx = 8-(-1)=9\text{.}\) Be sure that your figure (a) clearly shades the area being computed, (b) contains graphs of both \(f(x)\) and antiderivative \(F(x)\text{,}\) and (c) shows the difference in heights \(F(b)-F(a)\text{.}\)
-
Read section 4.4.3.
-
Do these problems.
-
-
Use the Fundamental Theorem of Calculus to evaluate \(\displaystyle \int_{2}^{4} e^{x} \ dx\text{.}\)
-
Calculate \(\displaystyle \int_{0}^{1} 2xe^{x^2}\ dx\) two ways: (i) numerically using GeoGebra and (ii) exactly using the fundamental theorem of calculus. How do these values compare?
-
Give examples of two different functions \(f(x)\) and limits of integration \(a\) and \(b\) such that \(\displaystyle \int_{a}^{b} f(x) \ dx = e^{4} - e^{2}\text{.}\)
-
-
Find two antiderivatives of \(g(x) = \sec x \tan x\text{.}\)
-
-
📝 [Submit] Explore the applet Practice Applying the Fundamental Theorem of Calculus by trying a few of these by hand and checking that you get the same result. Take a screen capture of one problem it presents and submit with it your written work showing that you get the same result.
Section After class
Solidifying the concepts discussed in class through practice is necessary to build your skills.
-
Read section 4.4.4.
-
Watch video Applications of the Total Change Theorem (6:40).
-
Read section 4.4.5 - summary.
-
Start working on the MOMwork (MyOpenMath) assignment for this section.
Section Advanced learning objectives
In addition to mastering the basic objectives, here are the tasks you should be able to perform after class, with practice:
-
Compute the family of antiderivatives of a function.
-
Explain why two antiderivatives of the same function only differ by a constant.
-
State the Total Change Theorem and explain it’s relationship to the Fundamental Theorem of Calculus.
-
Apply the Total Change Theorem to solve applied problems.
Section Additional suggestions
-
Watch video First Fundamental Theorem of Calculus (8:00).
-
Explore another good applet illustrating the Fundamental Theorem of Calculus Part 1.
-
Do these problems.
-
Find a single antiderivative for each of the following functions. In each case, you will want to reverse the chain rule.
-
\(\displaystyle \displaystyle f(x) = \cos (3x)\)
-
\(\displaystyle \displaystyle g(x) = 2\sin(x)\cos(x)\)
-
\(\displaystyle \displaystyle h(x) = \sin (2x)\)
-
-
Suppose you know that a certain function \(f\) is twice differentiable and that its graph over \([-4,8]\) is given in Figure 126. As you see, the printer was sloppy and spilled a lot of ink on the graph. Using the Fundamental Theorem of Calculus, decide whether each of the following definite integrals is positive, negative, or zero. Defend your answers.
-
\(\displaystyle \displaystyle{\int_{-2}^6f''(x)\ dx}\)
-
\(\displaystyle \displaystyle{\int_{-2}^6f'(x) \ dx}\)
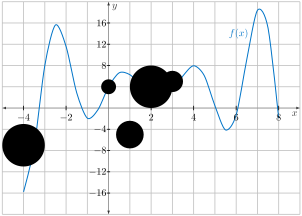
Figure 126. A printer has spilled ink on the graph of \(f\text{.}\) -
-
-
Do Activity 4.4.4.
-
Watch video solution to (a) and (b) to Activity 4.4.4 (3:27).
-
Watch video solution to (c) and (d) of Activity 4.4.4 (5:34).
-
Section Answers
-
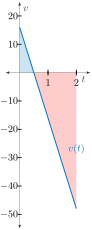
\(\displaystyle s(t) = -16t^{2} + 16t+32\)
-
Maximum height is at time \(t=1/2\) second. It lands at time \(t=2\) seconds.
-
\(s(\frac{1}{2})-s(0)=4\) feet; \(s(2)-s(\frac{1}{2}) = -36\) feet; \(s(2)-s(0)=-32\) feet. The first value represents the distance the balloon traveled upward from launch until it reached it’s peak. The second value represents the (signed) distance the balloon traveled from peak until hitting the ground (i.e. the displacement). The third value represents the displacement of the balloon from launch until hitting the ground.
-
40 feet
-
The total net signed area is 4-36=-32.
Subsection To prepare for class
-
2/3 is a reasonable answer for the area of the shaded region in Figure 128.
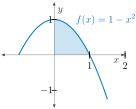
Figure 128. The area under \(f(x)=1-x^2\) between \(x=0\) and \(x=1\) is \(\frac{2}{3}\text{.}\) -
-
\(9/4-1=5/4\text{;}\) this is the signed area shown in Figure 129.
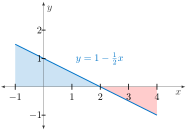
Figure 129. The signed area under \(f(x)=1-\frac{1}{2}x\) between \(x=-1\) and \(x=4\) is \(\frac{5}{4}\text{.}\) -
\(\displaystyle \int_{-1}^{4} 1-\frac{1}{2}x \ dx = F(4)-F(1) = 5/4\) where \(F(x) = x - \frac{1}{4}x^{2}\text{,}\) for example.
-
-
\(\displaystyle \sin(\frac{\pi}{2}) - \sin(0)=1\) is a reasonable answer for the area of the shaded region in Figure 130.
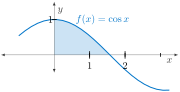
Figure 130. The signed area under \(f(x)=\cos(x)\) between \(x=0\) and \(x=\frac{\pi}{2}\) is 1.
Subsection More to prepare for class
-
-
\(\displaystyle \displaystyle \int_{2}^{4} e^{x} \ dx = e^{4} - e^{2}\)
-
\(\displaystyle \int_{0}^{1} 2xe^{x^2}\ dx = F(1)-F(0) = e^{1}-1\) where \(F(x) = e^{x^2}\) is one antiderivative of \(f(x) = 2xe^{x^2}\text{.}\) GeoGebra should estimate this to be 1.71.
-
If \(f(x) = e^{x}\text{,}\) then \(\displaystyle \int_{2}^{4} e^{x} \ dx = e^{4} - e^{2}\) If \(g(x) = 2xe^{x^2}\text{,}\) then \(\displaystyle \int_{\sqrt{2}}^{2} 2xe^{x^2}\ dx = e^{4} - e^{2}\) since \(G(x) = e^{x^2}\) is one antiderivative of \(g(x)\text{.}\)
-
-
\(G_{1}(x) = \sec x\) and \(G_{2}(x)=\sec x + 7\) work.
Subsection Additional suggestions
-
-
\(\displaystyle \displaystyle F(x) = \frac{1}{3}\sin(3x)\)
-
\(\displaystyle \displaystyle G(x) = (\sin x)^{2}\)
-
\(\displaystyle \displaystyle H(x) = -\frac{1}{2}\cos(2x)\)
-
-
-
positive
-
negative
-

