
Activity 1.
The following questions concern the position function given by \(s(t) = 64 - 16(t-1)^2\text{,}\) considered in the Preview Activity, and plotted in the given figure.
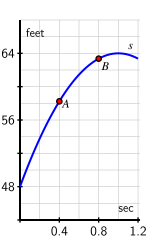
A plot of \(s(t) = 64 - 16(t-1)^2\) on the interval \(0 \lt t \lt 1.2\) is shown. On the horizontal axis, there are tick marks every \(0.4\) units at \(0.4\text{,}\) \(0.8\text{,}\) and \(1.2\text{.}\) On the vertical axis, the values from \(0 \lt y \lt 42\) are omitted to focus on the most important behavior of the graph. The vertical axis has tickmarks every \(6\) units from the point \((0,42)\) at the origin up to \(70\text{.}\)
The parabolic curve \(s(t) = 64 - 16(t-1)^2\) has \(y\)-intercept \((0,48)\) and then rises to its vertex at \((1,64)\text{.}\) The points \(A = (0.4, s(0.4))\) and \(A = (0.8, s(0.8))\) are shown on the plot.
(a)
Compute the average velocity of the ball on each of the following time intervals: \([0.4,0.8]\text{,}\) \([0.7,0.8]\text{,}\) \([0.79, 0.8]\text{,}\) \([0.799,0.8]\text{,}\) \([0.8,1.2]\text{,}\) \([0.8,0.9]\text{,}\) \([0.8,0.81]\text{,}\) \([0.8,0.801]\text{.}\) Include units for each value.
Hint.
On \([0.4,0.8]\text{,}\) the average velocity is \(AV_{[0.4,0.8]} = \frac{s(0.8)-s(0.4)}{0.8-0.4}\) ft/sec.
Answer.
\(AV_{[0.4,0.8]} = 12.8\) ft/sec; \(AV_{[0.7,0.8]} = 8\) ft/sec; the other average velocities are, respectively, 6.56, 6.416, 0, 4.8, 6.24, 6.384, all in ft/sec.
Solution.
On \([0.4,0.8]\text{,}\) the average velocity is \(AV_{[0.4,0.8]} = \frac{s(0.8)-s(0.4)}{0.8-0.4} = \frac{63.36-58.24}{0.4} = 12.8\) ft/sec. On \([0.7,0.8]\text{,}\) the average velocity is 8 ft/sec. The other average velocities are, respectively (in the order of the intervals listed in the activity), 6.56, 6.416, 0, 4.8, 6.24, 6.384, all measured in feet per second.
(b)
On the graph provided in (a), sketch the line that passes through the points \(A=(0.4, s(0.4))\) and \(B=(0.8, s(0.8))\text{.}\) What is the meaning of the slope of this line? In light of this meaning, what is a geometric way to interpret each of the values computed in the preceding question?
Hint.
Remember that the slope of a line can be found by taking “rise over run.” In this context, the slope is found by computing “change in \(s\) over change in \(t\text{.}\)”
Answer.
\(m = 12.8\) is the average velocity of the ball between \(t = 0.4\) and \(t = 0.8\text{.}\)
Solution.
The slope of the line between \(A(0.4, s(0.4))\) and \(B(0.8, s(0.8))\) is \(\frac{s(0.8)-s(0.4)}{0.8-0.4} = 12.8\text{.}\) This is precisely the average velocity of the ball between \(t = 0.4\) and \(t = 0.8\text{,}\) and indeed each of the average velocities computed in (a) can be viewed as the slope of the line joining the points \((a,s(a))\) and \((b,s(b))\text{.}\)
(c)
Use a graphing utility to plot the graph of \(s(t) = 64 - 16(t-1)^2\) on an interval containing the value \(t = 0.8\text{.}\) Then, zoom in repeatedly on the point \((0.8, s(0.8))\text{.}\) What do you observe about how the graph appears as you view it more and more closely?
Hint.
While the curve \(s(t)\) is a parabola, how does it look up close on a very small interval?
Answer.
Like a straight line with slope about 6.4.
Solution.
As we zoom in on the curve \(s(t) = 64 - 16(t-1)^2\) at the point \((0.8, 63.36)\text{,}\) the graph begins to look like a straight line. Indeed, it appears to look like a straight line with slope about 6.4.
(d)
What do you conjecture is the velocity of the ball at the instant \(t = 0.8\text{?}\) Why?
Hint.
“Instantaneous” velocity can be approximated by average velocity on a very small interval.
Answer.
About 6.4 feet per second.
Solution.
Observe that the average velocity of the ball on the intervals \([0.799,0.8]\) and \([0.8,0.801]\) is 6.416 and 6.384 feet/sec respectively. Hence it appears that the ball’s velocity at the instant \(t = 0.8\) should be about 6.4 feet per second.

