Handout Daily Prep 1.4 - The Derivative Function

Section Overview

We have recently learned that we can describe the instantaneous rate of change of a function \(f\) at a value \(a\) by computing \(\displaystyle f'(a)=\lim_{h\rightarrow 0}\frac{f(a+h)-f(a)}{h}\text{,}\) provided this limit exists. When we can find \(f'(a)\text{,}\) we understand that this value represents the instantaneous rate of change of the function with respect to the input variable, and also the slope of the tangent line to the curve \(y=f(x)\) at the point \((a,f(a))\text{.}\)
By viewing the constant \(a\) as a variable in its own right, we will next begin thinking about how \(y=f'(x)\) is itself a function, indeed a function that is related to - or derived from - the original function \(f\text{.}\) One of the next big questions is: given a function \(y=f(x)\text{,}\) can we find a graph of or formula for or other information about this new function \(f'(x)\text{?}\)
The section covers the following topics: The derivative as a function. The relationship between the graph of \(f\) and the graph of \(f'\text{.}\) Computing the derivative function of basic functions using the definition of the derivative.

Section Basic learning objectives

These are the tasks you should be able to perform with reasonable fluency when you arrive at our next class meeting. Important new vocabulary words are indicated in italics.
  • State the definition of the derivative function.
  • Illustrate on a graph how a function can fail to be differentiable at a point.

Section To prepare for class

Complete all actions listed below. Respond to the questions highlighted with Submit.

Checkpoint 31. Connecting a Function to its Derivative.

Section After class

Solidifying the concepts discussed in class through practice is necessary to build your skills.

Section Advanced learning objectives

In addition to mastering the basic objectives, here are the tasks you should be able to perform after class, with practice:
  • Given a graph of a function \(f\text{,}\) identify the graph of its derivative \(f'\) from a list, and describe aspects of the behavior of the graph of \(f'\text{.}\)
  • Sketch the graph of the derivative \(f'(x)\) given the graph of \(f(x)\text{.}\)
  • Given an algebraic description of a function, derive a formula for the derivative function using the definition of the derivative.

Section Additional suggestions

  • Do these exercises.
    1. Complete the following computation giving the derivative of the function \(f(x) = x^{2} - 4\text{.}\) Then, graph \(f(x)\) and \(f'(x)\) together.
      \begin{align*} f'(x) = \mathstrut \amp \lim_{h \rightarrow 0} \frac{f(x+h)-f(x)}{h} \\ = \mathstrut \amp \lim_{h \rightarrow 0} \frac{(x+h)^2-4-[x^2-4]}{h} \\ = \mathstrut \amp \cdots \end{align*}
      1. Determine the values of \(g'(0)\text{,}\) \(g'(1)\text{,}\) \(g'(2)\text{,}\) and \(g'(3)\) if \(g(x) = |x^{2} - 4|\text{.}\)
      2. Sketch the graph of \(g(x)\) and \(g'(x)\text{.}\)
      3. Is \(g\) differentiable at \(x=-2\text{?}\) Is \(g\) continuous at \(x=-2\text{?}\)

Section Answers

Subsection To prepare for class

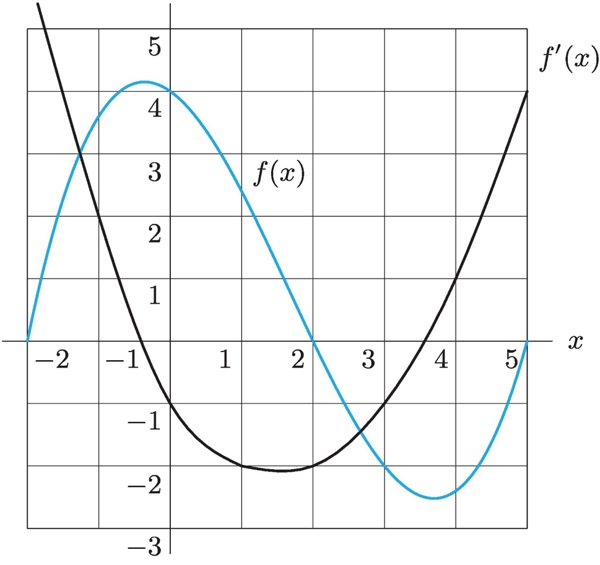
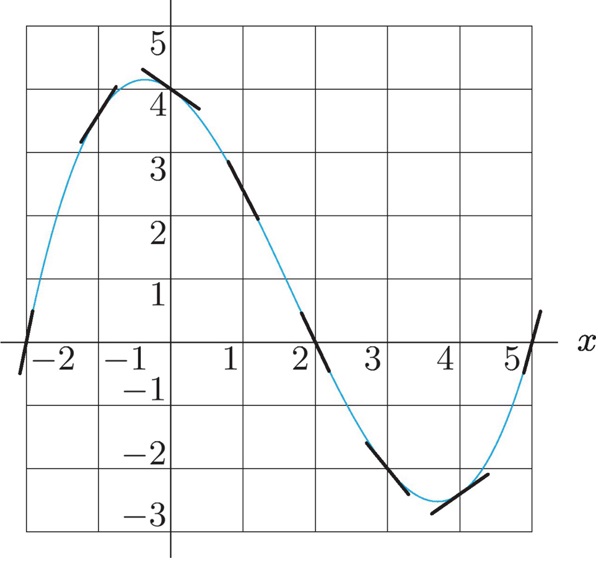
  1. The values in TableΒ 32 are estimates.
    Table 32. A table of the slopes of a given function.
    \(x\) -2 -1 0 1 2 3 4 5
    \(f'(x)\) 6 2 -1 -2 -2 -1 1 4
    Graph showing two functions on the same coordinate grid. The horizontal axis is labeled x and the vertical axis is labeled y, with integer tick marks shown. One curve is labeled f(x) and the other is labeled fβ€²(x). The curve labeled f(x) is a smooth blue curve. It increases from the left, reaching a local maximum near x = βˆ’1 at a y-value slightly above 4. It then decreases, crossing the x-axis near x = 2, and continues downward to a local minimum near x = 4 with a y-value below βˆ’2. After this minimum, the curve increases again toward the right end of the graph. The curve labeled fβ€²(x) is a smooth black curve with a U-shaped appearance. It crosses the x-axis near x = βˆ’1 and x = 4 and has a local minimum below the x-axis near x = 2. The graph illustrates the relationship between f and its derivative: where f(x) has a local maximum or minimum, the derivative fβ€²(x) is zero, and where f(x) is increasing or decreasing, fβ€²(x) is positive or negative, respectively. There are no breaks or open circles shown on either curve, indicating both functions are continuous over the displayed interval."
    Figure 33.
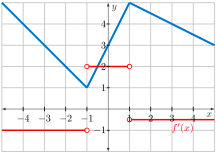
  2. The graph of \(f'\) is in red in FigureΒ 34.
    Graph showing a piecewise-defined function f and its derivative fβ€² on the same coordinate grid. The horizontal axis is labeled x and the vertical axis is labeled y, with integer tick marks shown. The graph of f(x) is drawn with solid line segments. On the left, f decreases linearly from the upper left and reaches a sharp corner at the point (βˆ’1, 1). From (βˆ’1, 1), the graph increases linearly to a peak near (1, 5). From that peak, f decreases linearly again to the right, ending near the point (5, 3). The corners at x = βˆ’1 and x = 1 indicate points where the slope changes abruptly. Several red open circles appear on the graph of f(x). One open circle is shown at the point (βˆ’1, 2), and another at (1, 2), indicating values that are not attained by the function at those x-values. Below the x-axis, the graph of fβ€²(x) is shown using horizontal red line segments. For x less than βˆ’1, fβ€²(x) is a constant negative value, shown by a horizontal segment ending with an open circle at x = βˆ’1. For x between 1 and 5, fβ€²(x) is a constant positive value, shown by a horizontal segment starting with an open circle at x = 1. There is no value of fβ€² shown at the corner points x = βˆ’1 and x = 1, indicating the derivative does not exist at those points. The figure illustrates the relationship between a piecewise linear function and its derivative, emphasizing constant slopes on intervals and non-differentiability at corners."
    Figure 34. The graph of \(f'(x)\) given a graph of \(f(x)\text{.}\)
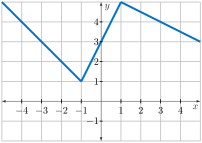
    1. The domain of \(f\) is larger than the domain of \(f'\) (note the holes).
    2. \(\displaystyle \lim_{h \rightarrow 0^-}\frac{f(1+h)-f(1)}{h}= 2\) while \(\displaystyle \lim_{h \rightarrow 0^+}\frac{f(1+h)-f(1)}{h}= -\frac{1}{2}\text{.}\) This tells us that \(f'(1)\) does not exist.

Subsubsection Additional suggestions

  1. Be sure to master this type of computation!
    \begin{align*} f’(x) = \amp \lim_{h \rightarrow 0}\frac{f(x+h) - f(x)}{h} \\ = \mathstrut \amp \lim_{h \rightarrow 0} \frac{ (x+h)^{2} - 4 - [x^{2} - 4]}{h} \\ = \mathstrut \amp \lim_{h \rightarrow 0} \frac{x^{2} + 2xh+h^{2}-4 - x^{2} + 4}{h} \\ = \mathstrut \amp \lim_{h \rightarrow 0} \frac{2xh+h^{2}}{h} \\ = \mathstrut \amp \lim_{h \rightarrow 0} 2x + h \\ = \mathstrut \amp 2x \end{align*}
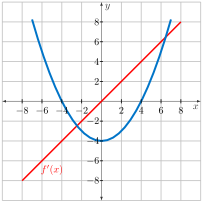
    The graph of \(f'(x)\) in FigureΒ 35 is in red.
    Graph showing two functions on the same coordinate grid. The horizontal axis is labeled x and the vertical axis is labeled y, with integer tick marks shown. One graph is a smooth blue curve shaped like an upward-opening parabola. It has a minimum near the point (0, βˆ’4) and is symmetric about the y-axis. The parabola crosses the x-axis near x = βˆ’4 and x = 4 and increases on both sides of its minimum. The second graph is a straight line labeled fβ€²(x). This line has positive slope and passes through the origin. It crosses the x-axis at x = 0 and increases steadily from left to right. The figure illustrates the relationship between a function and its derivative. Where the parabola is decreasing to the left of x = 0, the derivative is negative, and where the parabola is increasing to the right of x = 0, the derivative is positive. The minimum of the parabola occurs where fβ€²(x) equals zero."
    Figure 35. The graph of \(f'(x)=2x\) given a graph of \(f(x)=x^2-4\text{.}\)
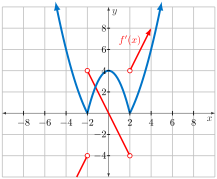
    1. \(g'(0) = 0\text{,}\) \(g'(1) =-2\text{,}\) \(g'(2)\) does not exist (the two one-sided limits are different), \(g'(3)=6\text{.}\)
    2. The graphs of \(g(x)\) and \(g'(x)\) are shown in blue and red in FigureΒ 36 respectively.
      Graph showing a function f and its derivative fβ€² on the same coordinate grid. The horizontal axis is labeled x and the vertical axis is labeled y, with integer tick marks shown. The graph of f(x) is drawn with a thick blue curve. On the left and right, the graph rises steeply upward, with arrows indicating that the function continues to increase beyond the edges of the graph. Between x = βˆ’2 and x = 2, the graph forms a smooth, curved arch that reaches a local maximum near the point (0, 4). At x = βˆ’2 and x = 2, the graph has sharp corners at the points (βˆ’2, 1) and (2, 1), indicating that f is not differentiable at those x-values. The graph of fβ€²(x) is shown in red. It consists of several line segments and rays with open circles indicating points where the derivative is not defined. One red segment with negative slope appears between x = βˆ’2 and x = 2, crossing the y-axis near y = βˆ’1 and ending with open circles near x = βˆ’2 and x = 2. Additional red rays appear to the left of x = βˆ’2 and to the right of x = 2 with positive slope, each starting at an open circle. The figure emphasizes the relationship between a function and its derivative, showing that fβ€²(x) is undefined at the corner points of f and changes sign according to whether f is increasing or decreasing."
      Figure 36. The graph of \(f'(x)=2x\) given a graph of \(f(x)=|x^2-4|\text{.}\)
    3. \(g\) is not differentiable at \(x=-2\text{.}\) \(g\) is continuous at \(x=-2\text{.}\)