
Activity 59.
For each of the following functions, sketch an accurate graph of the continuous antiderivative that satisfies the given initial condition. In addition, sketch the graph of two additional antiderivatives of the given function, and state the corresponding initial conditions that each of them satisfy.
(a)
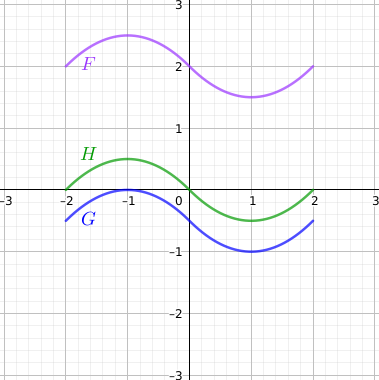
original function: \(g(x) = \left| x \right| - 1\text{;}\) initial condition: \(G(-1) = 0\text{;}\) interval for sketch: \([-2,2]\)
Hint.
Answer.
Solution.
A possible antiderivative \(G\) that satisfies \(G(-1) = 0\) is shown in Figure 198, with a possible formula being \(G(x) = -\frac{1}{2}x^2 - x - \frac{1}{2}\) for \(x \lt 0\) and \(G(x) = \frac{1}{2}x^2 - x - \frac{1}{2}\) for \(x \ge 0\text{.}\) Other antiderivatives that satisfy \(F(0) = 2\) and \(H(0) = 0\) are also shown.
(b)
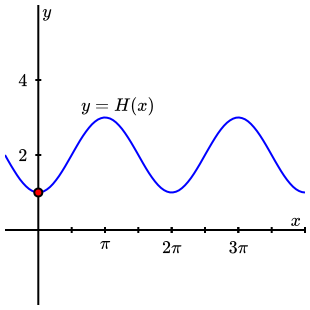
original function: \(h(x) = \sin(x)\text{;}\) initial condition: \(H(0) = 1\text{;}\) interval for sketch: \([0,4\pi]\)
Note: the area bounded by one hump of the sine function is exactly \(2\) (e.g., on the interval \([0, \pi]\)).
Hint.
Answer.
Solution.
Thinking both graphically and algebraically reveals that the antiderivative we seek is \(H(x) = -\cos(x) + 2\text{.}\) Any vertical shift of this function will have the same derivative, but will have a different \(y\)-intercept. The antiderivative that satisfies \(H(0)=1\) is shown in Figure 200.
(c)
original function:
\begin{equation*}
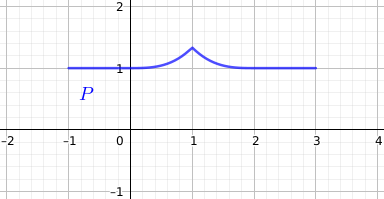
p(x) = \begin{cases}x^2, \amp \text{ if } 0 \lt x \lt 1 \\ -(x-2)^2, \amp \text{ if } 1 \lt x \lt 2 \\ 0 \amp \text{ if } x \le 0 \text{ or } x \ge 2 \text{;}\end{cases}
\end{equation*}
initial condition: \(P(0) = 1\text{;}\) interval for sketch: \([-1,3]\)
Note: the area bounded by \(x^2\) on \(0 \lt x \lt 1\) is \(\frac13\text{;}\) the region bounded by the other quadratic piece of \(p(x)\) is similar.
Hint.
Answer.
Solution.

