Handout Exam 3 - Fall 2025

Section Topics

3.1-4.2
Be sure to try each question before looking at the solutions.

Exercises Questions

1.

A rescue drone is hovering 15 meters above the ground and is lowering a supply box to a hiker using a rope. The rope is released (vertically) at a constant rate of 3 meters per second. At the moment the box is released, the hiker is walking away from the point directly beneath the drone at a speed of 1 meter per second. When the box is 3 meters above the ground, how fast is the distance between the supply box and the hiker changing?
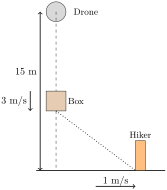
Figure 246. A rescue drone lowers a supply box to a hiker.
Answer.
Let \(x(t)\) denote the distance of the hiker from a point directly below the drone at time \(t\text{.}\) Let \(y(t)\) denote the height of the box at time \(t\text{.}\)
Known: \(\displaystyle \frac{dy}{dt} = -3 \ \frac{m}{sec}, \frac{dx}{dt} = 1 \ \frac{m}{sec}\)
We find: \(\displaystyle \frac{dz}{dt}\) when \(y(t)=3\) meters (\(t=4\) seconds)
But
\begin{equation*} x(t)^2 + y(t)^2 = z(t)^2 \end{equation*}
so that
\begin{equation*} 2x(t)\frac{dx}{dt} + 2y(t)\frac{dy}{dt} = 2z(t)\frac{dz}{dt} \end{equation*}
and thus
\begin{align*} \frac{dz}{dt}\vert_{y=3} \mathstrut \amp = \frac{x(t) \frac{dx}{dt} + y(t) \frac{dy}{dt}}{z(t)}\vert_{y=3} \\ \amp = \frac{ (4 \ m)(1 \ \frac{m}{sec}) + (3 \ m)(-3 \ \frac{m}{sec})}{5 \ m} \\ \amp = -1 \ \frac{m}{sec} \end{align*}
2.

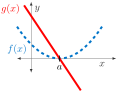
In FigureΒ 247, \(f(x)\) is the dashed curve and \(g(x)\) is the solid curve (the line). Is
\begin{equation*} \displaystyle \lim_{x \rightarrow a}\frac{f(x)}{g(x)} \end{equation*}
positive, negative, zero, or undefined?
Figure 247. \(f(x)\) is the dashed curve and \(g(x)\) is the solid curve.
  • Positive
  • Negative
  • Zero
  • Correct.
  • Undefined

3.

The function \(\displaystyle f(x) = \frac{3-4e^{-x}}{2+2e^{-x}}\) has two horizontal asymptotes. Use limits to carefully determine the equations of each asymptote. Unsupported work will not receive credit.
Answer.
\(y=\frac{3}{2}\) is a horizontal asymptote since
\begin{equation*} \lim_{x \rightarrow \infty} f(x) = \lim_{x \rightarrow \infty} \frac{3-4e^{-x}}{2+2e^{-x}} = \frac{3}{2}. \end{equation*}
\(y=-2\) is another horizontal asymptote since, using L’Hopital’s rule, we have
\begin{align*} \lim_{x \rightarrow -\infty} f(x) \mathstrut \amp = \lim_{x \rightarrow -\infty} \frac{3-4e^{-x}}{2+2e^{-x}} \\ \amp = \lim_{x \rightarrow -\infty} \frac{4e^{-x}}{-2e^{-x}} \\ \amp = -2. \end{align*}

4.

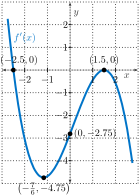
A function satisfying \(f(0)=-1\) that is differentiable everywhere has the graph of \(f'(x)\) as shown in FigureΒ 248.
Figure 248. \(f(x)\) is differentiable everywhere.
  1. Construct a first-derivative sign chart to determine interval(s) of the domain where \(f\) is increasing and where \(f\) is decreasing.
  2. Construct a second-derivative sign chart to determine interval(s) of the domain where \(f\) is concave up and where \(f\) is concave down. Identify all inflection points as well.
  3. Assume that all of the interesting information about \(f'(x)\) is shown in FigureΒ 248. Does \(f(x)\) have any local minima? If so, where? If not, why not? Does it have any local maxima?
Answer.
  1. \(f(x)\) is increasing on \((-\infty, -2.5)\) and decreasing on \((-2.5,-1.5) \cup (-1.5,\infty)\text{.}\)
    A firat derivative sign chart.
    Figure 249. A first derivative sign chart.
  2. \(f(x)\) is concave down on \((-\infty, -\frac{7}{6}) \cup (1.5,\infty)\) and concave up on \((-\frac{7}{6},1.5)\text{.}\) There are inflection points at \(x=-\frac{7}{6}\) and \(x=1.5\text{.}\)
    A second derivative sign chart.
    Figure 250. A second derivative sign chart.
  3. \(f(x)\) has a local maximum at \(x=-2.5\) via the second derivative test. \(f(x)\) has no local minimum since \(f(x)\) does not change from decreasing to increasing anywhere.

5.

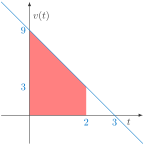
The velocity of a falling object at time \(t\) seconds is given by \(v(t) = 9-3t\) feet per second. Determine the distance the object has traveled during the time interval of \(t=0\) to \(t=2\) seconds. Illustrate this value with a well-labeled diagram.
Answer.
The distance traveled is \(6+\frac{1}{2}(2)(6) = 12\) feet.
Figure 251. The velocity of a falling object gives the distance it has traveled via area under the curve.

7.

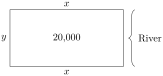
A rancher wants to create a rectangular plot of 20,000 square feet bounded on one long east-west side by a river. Due to strong southern winds, fencing costs 4 times as much per foot for the east-west side as for the north-south sides. What dimensions minimize the fencing cost?
Answer.
Let \(x\) denote the width of the rectangular plot perpendicular to the river, and let \(y\) denote the length parallel to the river. Since fencing is required on only three sides, the total cost is
\begin{equation*} C = 4y + 2x. \end{equation*}
The area constraint is
\begin{equation*} xy = 20,000. \end{equation*}
A plot near a river.
Figure 252. A rectangular plot bordering a river.
Solving the area constraint for \(y\) gives
\begin{equation*} y = \frac{20,000}{x}. \end{equation*}
Substitute this expression into the cost function:
\begin{equation*} C(x) = 4\left(\frac{20,000}{x}\right)+2x = \frac{80,000}{x}+2x, \end{equation*}
where \(x>0\text{.}\)
Differentiate:
\begin{equation*} C'(x) = -80,000x^{-2}+2. \end{equation*}
Set the derivative equal to zero and solve:
\begin{equation*} -80,000x^{-2}+2=0, \end{equation*}
\begin{equation*} x^2=40,000, \end{equation*}
\begin{equation*} x=\pm 200. \end{equation*}
Since \(x\) represents a length, \(x>0\text{,}\) so the only relevant critical value is
\begin{equation*} x=200. \end{equation*}
A sign analysis shows that \(C'(x)<0\) for \(0<x<200\) and \(C'(x)>0\) for \(x>200\text{.}\) Therefore, \(C(x)\) is minimized when \(x=200\text{.}\)
Using the area constraint,
\begin{equation*} y=\frac{20,000}{200}=100. \end{equation*}
Therefore, the dimensions that minimize the fencing cost are
\begin{equation*} x=200\text{ feet}, \qquad y=100\text{ feet}. \end{equation*}
The optimal plot is \(200\) feet by \(100\) feet.

8.

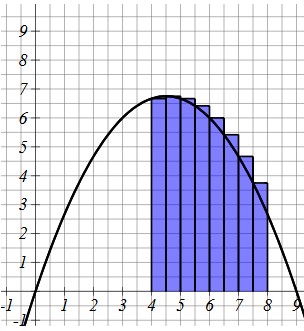
The rectangles in FigureΒ 253 illustrate a left-endpoint Riemann sum \(\displaystyle \sum_{k=1}^{n} f(x_{k}^{*}) \ \Delta x\) for the function \(\displaystyle f(x) = -\frac{x^{2}}{3}+ 3x\) on the interval \([4,8]\) .
Figure 253. A Riemann sum.
  1. What is the value of \(\Delta x\) in this Riemann sum?
  2. Give an explicit formula for \(x_{k}^{*}\) in terms of the index \(k\) in the Riemann sum.
  3. Illustrate a right-endpoint Riemann sum \(R_{2}\) using \(n=2\) rectangles for \(f(x)\) on the interval \([0,3]\) on the graph. Then, calculate the value of \(R_{2}\) .
Answer.
  1. \(\displaystyle \Delta x = 0.5\)
  2. \(x_k^* = 4+(k-1)(0.5)\) or \(x_k^* = 3.5 + 0.5k\)
  3. \begin{align*} R_2 \mathstrut \amp = f(1.5)(1.5) + f(3)(1.5) \\ \amp = \left[ -\frac{1.5^2}{3}+3(1.5) \right](1.5) + \left[ -\frac{3^2}{3} + 3(3)\right](1.5) \\ \amp 14.625 \end{align*}

9.

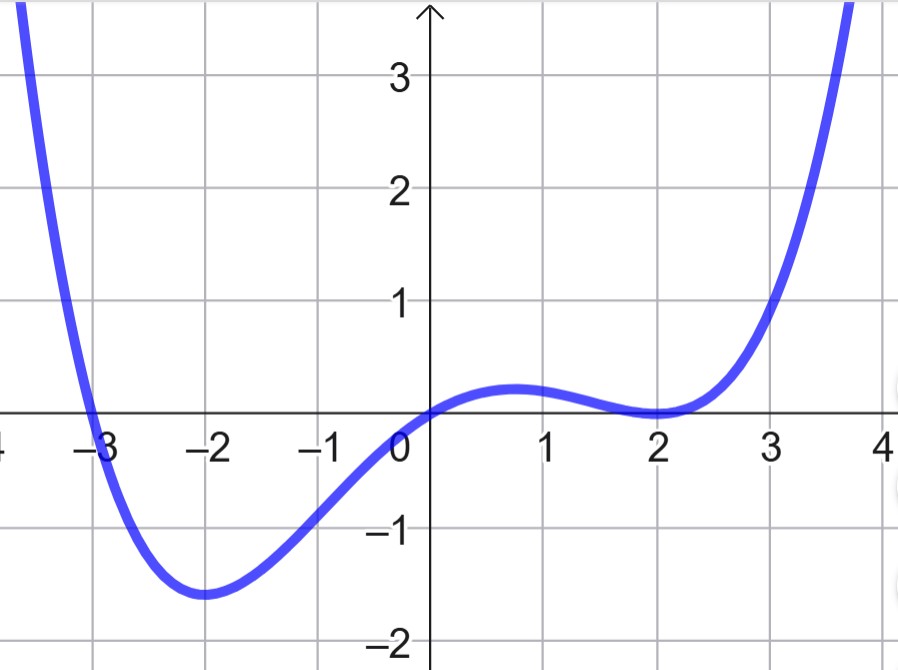
The graph of \(f''(x)\) is given in FigureΒ 254.
Graph of a smooth curve with a local minimum near x = -2, a local maximum near x = 1, and another local minimum near x = 2 where the curve touches the x-axis before rising sharply.
Figure 254. A graph of \(f''(x)\text{.}\)
  1. If \(x=-2\) and \(x=1\) are critical numbers of \(f(x)\) , determine if each is a local minimum, local maximum, neither, or if more information is needed.
  2. Identify the \(x\) -value(s) for which \(f(x)\) has an inflection point.
Answer.
  1. \(x=-2\) gives a local maximum since \(f''(-2) < 0\text{.}\) \(x=1\) gives a local minimum since \(f''(1) > 0\text{.}\)
  2. There are inflection points at \(x=-3\) and \(x=0\) since \(f''(x)\) changes sign.