
Activity 20.
Suppose it is known that for a given differentiable function \(y = g(x)\text{,}\) its local linearization at the point where \(a = -1\) is given by \(L(x) = -2 + 3(x+1)\text{.}\)
(a)
Compute the values of \(L(-1)\) and \(L'(-1)\text{.}\)
Hint.
Follow the rule for \(L\text{.}\)
Answer.
\(L(-1) = -2\text{;}\) \(L'(-1) = 3\text{.}\)
Solution.
Using the formula for \(L\text{,}\) \(L(-1) = -2\text{;}\) Since \(L'(x) = 3\text{,}\) we see \(L'(-1) = 3\text{.}\)
(b)
What must be the values of \(g(-1)\) and \(g'(-1)\text{?}\) Why?
Hint.
Recall that the form of the local linearization is \(L(x) = g(a) + g'(a)(x-a)\text{.}\)
Answer.
\(g(-1) = -2\text{;}\) \(g'(-1) = 3\text{.}\)
Solution.
Since \(L(x) = g(-1) + g'(-1)(x+1) = -2 + 3(x+1)\text{,}\) we see \(g(-1) = -2\) and \(g'(-1) = 3\text{.}\) Alternatively, we could observe that the value and slope of \(g\) must match the value and slope of \(L\) at the point of tangency.
(c)
Do you expect the value of \(g(-1.03)\) to be greater than or less than the value of \(g(-1)\text{?}\) Why?
Hint.
Is the function \(g\) increasing or decreasing at \(a = -1\text{?}\)
Answer.
Less.
Solution.
Because \(g'(-1) = 3\text{,}\) we see that \(g'\) is increasing near \(a = -1\text{,}\) and therefore \(g(-1.03)\) is expected to be less than \(g(-1)\text{.}\)
(d)
Use the local linearization to estimate the value of \(g(-1.03)\text{.}\)
Hint.
Remember that \(g(-1.03) \approx L(-1.03)\text{.}\)
Answer.
\(g(-1.03) \approx L(-1.03) = -2.09\text{.}\)
Solution.
Observe that \(g(-1.03) \approx L(-1.03) = -2 + 3(-1.03+1) = -2 - 0.09 = -2.09\text{.}\)
(e)
Suppose that you also know that \(g''(-1) = 2\text{.}\) What does this tell you about the graph of \(y = g(x)\) at \(a = -1\text{?}\)
Hint.
What does the second derivative tell you about the shape of a curve?
Answer.
Concave up.
Solution.
Since \(g''(-1) > 0\text{,}\) we know \(g\) is concave up at \(x = -1\text{.}\)
(f)
For \(x\) near \(-1\text{,}\) sketch the graph of the local linearization \(y = L(x)\) as well as a possible graph of \(y = g(x)\) on the axes provided.
ADD ALT TEXT TO THIS IMAGE
Hint.
Use your work above.
Answer.
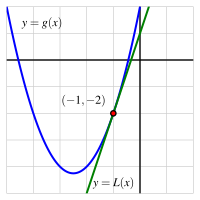
The illustration below shows a possible graph of \(y = g(x)\) near \(x = -1\text{,}\) along with the tangent line \(y = L(x)\) through \((-1, g(-1))\text{.}\)
ADD ALT TEXT TO THIS IMAGE
Solution.
In the figure below, we use the results of our previous work to generate the plot shown, which is a possible graph of \(y = g(x)\) near \(x = -1\text{,}\) along with the tangent line \(y = L(x)\) through \((-1, g(-1))\text{.}\)
ADD ALT TEXT TO THIS IMAGE

