
Activity 6.
For the moving object whose position \(s\) at time \(t\) is given by the graph provided, answer each of the following questions. Assume that \(s\) is measured in feet and \(t\) is measured in seconds.
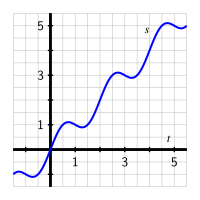
The function \(y = s(t) = t + 0.5\sin(\pi t)\) is graphed on the interval \(-1.5 \lt t \lt 5.5\text{.}\) The vertical scale is the same as the horizontal scale. The graph rises and falls periodically, doing so above and below the line \(y = t\text{.}\)
(a)
Use the graph to estimate the average velocity of the object on each of the following intervals: \([0.5,1]\text{,}\) \([1.5,2.5]\text{,}\) \([0,5]\text{.}\) Draw each line whose slope represents the average velocity you seek.
Hint.
Remember that average velocity on an interval computes the quotient of “change in \(s\) over change in \(t\text{.}\)” This is the slope of the line between the corresponding two points on the graph of \(s\text{.}\)
Answer.
\(AV_{[0.5,1]} = \frac{1-1}{1-0.5} = 0\text{,}\) \(AV_{[1.5,2.5]} = \frac{3-1}{2.5-1.5} = 2\text{,}\) and \(AV_{[0,5]} = \frac{5-0}{5-0} = 1\text{.}\)
Solution.
The average velocity on \([0.5,1]\) is the slope of the line joining the points \((0.5,s(0.5))\) and \((1,s(1))\text{,}\) which is \(AV_{[0.5,1]} = \frac{1-1}{1-0.5} = 0\text{.}\) On \([1.5,2.5]\text{,}\) we similarly find \(AV_{[1.5,2.5]} = \frac{3-1}{2.5-1.5} = 2\text{,}\) and on \([0,5]\text{,}\) we have \(AV_{[0,5]} = \frac{5-0}{5-0} = 1\text{.}\)
(b)
How could you use average velocities or slopes of lines to estimate the instantaneous velocity of the object at a fixed time?
Hint.
Think about shorter and shorter time intervals and drawing the lines whose slopes represent average velocity.
Answer.
Take shorter and shorter time intervals and draw the lines whose slopes represent average velocity. If those lines’ slopes are approaching a single number, that number represents the instantaneous velocity.
Solution.
Take shorter and shorter time intervals and draw the lines whose slopes represent average velocity. If those lines’ slopes are approaching a single number, that number represents the instantaneous velocity. For example, to estimate the instantaneous velocity at \(t = 2\text{,}\) we might consider average velocities on \([2,3]\text{,}\) \([2,2.5]\text{,}\) and \([2,2.25]\text{.}\)
(c)
Use the graph to estimate the instantaneous velocity of the object when \(t = 2\text{.}\) Should this instantaneous velocity at \(t = 2\) be greater or less than the average velocity on \([1.5,2.5]\) that you computed in (a)? Why?
Hint.
Think about zooming in on the graph at \(t = 2\) and drawing a line that, up close, looks just like the curve \(s(t)\text{.}\) What is the approximate slope of that line?
Answer.
The instantaneous velocity at \(t = 2\) is greater than the average velocity on \([1.5,2.5]\text{.}\)
Solution.
If we draw the line through \((2,2)\) and \((2.1,s(2.1))\text{,}\) it looks like the line’s slope is approximately 2.5: if we go over one grid-width, we appear to go up about 2.5. The slope of this line is clearly greater than the slope of the line through \((1.5, s(1.5))\) and \((2.5, s(2.5))\text{,}\) which is 2. Hence the instantaneous velocity at \(t = 2\) is greater than the average velocity on \([1.5,2.5]\text{.}\)

