In Differential Calculus, we have regularly asked the question “What does the derivative of a given function tell us about the function itself?” Indeed, in many different settings, we have been given information about a function’s instantaneous rate of change, and used that information to determine characteristics of the function itself. In Chapter 4, we provide the most accurate and sophisticated answers to this big question. In particular, we will introduce the notion of the definite integral, which is an important counterpart to the derivative.
In Section 4.1, we start with a familiar question, but in reverse: where previously we were interested in an object whose position we know and sought to find its velocity, now we start with velocity, and see if we can find changes in position and/or distance traveled.
These are the tasks you should be able to perform with reasonable fluency when you arrive at our next class meeting. Important new vocabulary words are indicated in italics.
📝 [Submit] Explore the applet Displacement vs. Distance on a Velocity-Time Graph. If \(s(t)\) represents the displacement of an object at time \(t\text{,}\) and \(|s(t)|\) represents the distance traveled at at time \(t\text{,}\) answer the following:
Answer: It is the unsigned area under the given curve and above the \(t\)-axis. That is, it is simply the area sandwiched between the curve and the \(t\)-axis.
Prompt Copilot “What is the difference in interpretation or meaning between the area between two times \(t=a\) and \(t=b\) and between a velocity graph and the \(t\)-axis and the signed area between the same two times between a velocity graph and the \(t\)-axis?”
Watch video Finding Total (Dust) Accumulation (6:49). Then, calculate (and submit) an approximation for the total dust accumulation if you use the lower rate on each subinterval. That is, use the rate at the end of the segment rather than the rate at the beginning of the interval of motion.
For each velocity scenario, determine the correct value. Recall that displacement is the signed area under the velocity graph, while distance traveled is the total area between the graph and the \(t\)-axis. Match each situation with the correct conclusion.
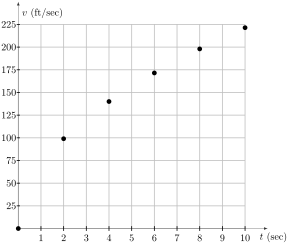
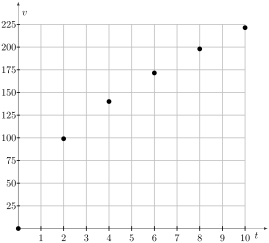
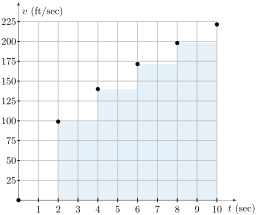
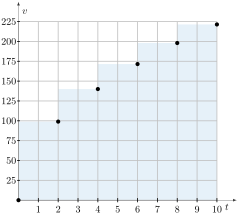
The following data is gathered as a small plane travels down the runway toward takeoff. How far did the plane travel in the 10 second period? (Give both a lower and an upper estimate.) Hint: Distance = Rate \(\times\) Time
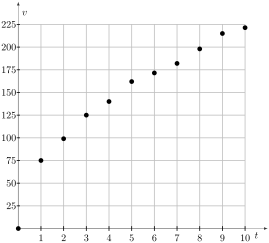
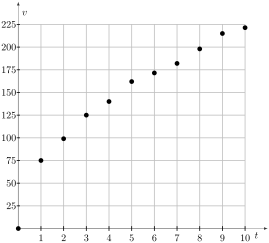
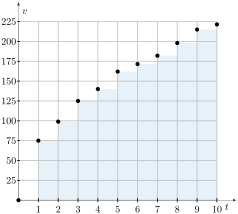
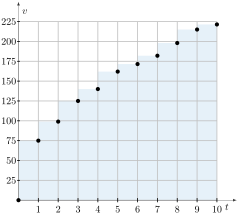
Suppose that the same small plane as in the previous problem is traveling toward takeoff, but that now we are given the velocity of the plane every second (as in the given table). Give a new range of values representing the distance that the plane could have traveled, and illustrate your estimates with a new rectangles diagram.